A Good Long-Term Hold: DG Khan Cement Company (Pakistan)

Stock: DG Khan (ticker DGKC; Pakistan Stock)
DG Khan Cement delivers consistent growth amid turbulent times
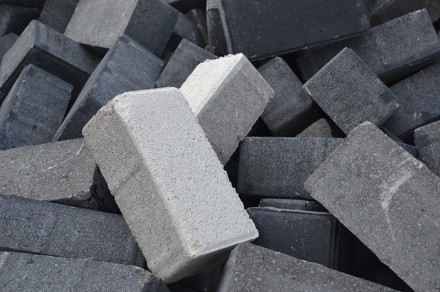
cement

There is no doubt that investors have taken Pakistan’s stock market to bear market beginning August amid political concerns, but it is always better to seek out good opportunities during these hard times.

One opportunity observed is one of the country’s $1.07 billion cement manufacturer, DG Khan Cement Company.

Valuations
The 39-year-old company trades at 0.9 PB ratio along with an 8.5 PE multiple and an attractive 3.9% dividend yield.

Average fiscal year estimates indicated forward sales and earnings multiples of 2.2 times and 7.67 times.

Total returns
DG Khan has provided nearly 30% total losses for its shareholders this year while the broader Pakistan ETF (ticker PAK) gave 18.2% total losses.

DG Khan Cement
D. G. Khan Cement Company Limited is a Pakistan-based cement manufacturing company. The Company is engaged in the production and sale of clinker, ordinary portland and sulfate resistant cement.

DG generates its revenues in Pakistan only and the Company’s segments include Cement, Paper and Dairy.

Pakistan Cement Industry witnessed an overall growth of 7% while DG’s revenue and profits rose by 6.2% and 1.2%, respectively, as of its recent nine months operations, having had 28.5% profit margin compared to 30% a year earlier.

Cement
The Cement segment is engaged in the production and sale of clinker, Ordinary Portland and Sulfate Resistant cement.
In its recent nine months of operations, Cement revenue increased 6% year over year to 22.63 billion PKR (89% of total unadjusted sales) and registered profit margins of 29% compared to 30% a year earlier.

Paper
The Paper segment manufactures and supplies paper products and packing material.
Revenue in the paper business grew 17% year over year to 1.84 billion PKR (7% of total unadjusted sales) and profit margins of 15% vs. 12% a year earlier.

Dairy
The Dairy segment is engaged in the production and sale of raw milk.
Dairy sales fell 9% year over year to 826.7 million PKR (3% of unadjusted sales) and losses of 279 million PKR compared to 475.4 million PKR a year earlier

Sales and profits
In the past three years, DG registered 5.78% revenue growth average, 95.5% profit growth average, and 23.4% margin average.

Cash, debt and book value
As of March (recent available filing), DG had 715 million PKR (Pakistani Rupee) in cash and cash equivalents and 19.2 billion PKR in debt with debt-equity ratio 0.26 times compared to 0.11 times a year earlier. Overall debt increased by 12.6 billion PKR while equity increased 11.1 billion in the same time period.

DG had no goodwill or intangibles in its 104.9 billion PKR assets while book value rose by 18.1% year over year to 72.7 billion PKR.

Cash flow
In its nine months operations that ended in March, DG had 2.25 billion PKR in cash flow from operations compared to 7.88 billion PKR in the same period last year. The company had more cash outflow in relation to its prepaid expenses resulting in lower cash flow in the recent period.

Capital expenditures were 18.96 billion PKR negative 16.7 billion in free cash outflow for the period. In addition, DG raised 6.78 billion in debt issuance (net repayments) and provided 18 million PKR in dividends to shareholders.

The cash flow summary
In the past three years, DG allocated 8.75 billion in capital expenditures, reduced its overall debt by 5.36 billion (net any issuances and other financing activities), provided 3.5 billion PKR or 21.1% of its free cash flow in dividends.

Conclusion
Other than its money losing dairy business (3% of unadjusted sales), DG has impressively exhibited steady strong growth in all of its businesses. The company also had a solid growing balance sheet missing any goodwill or intangible elements.

DG also has maintained conservative dividend shareholder payouts in recent years.

Using historical multiples and revenue growth average figures with a 10% margin indicated a per share figure of 156.13 PKR compared to 155.83 PKR at the time of writing.

In summary, DG is a hold.
Disclosure: I do not have shares in any of the companies mentioned.

Relentless Growth by Wayfair

Stock: WAYFAIR (TICKER: W)

Market rewards the company for being able to deliver strong revenue growth
99.09% Total Gains by Wayfair So Far This Year

hotel-389256_640

Wayfair has incredibly far exceeded returns of the broader index despite ongoing losses
Wayfair was recently credited as the “Amazon of Home.”  

This could make some sense brought by the company’s unique business proposition for its customers, the online shoppers.

The $6 billion Massachusetts-based e-commerce retailer reported its second quarter results recently. Wayfair reported an impressive 35.8% revenue growth to $2.08 billion in its first half of operations this year while having (-)$95.4 million in losses compared to (-)$89.5 million in the same period last year.
Wayfair recorded 30.9% growth in its operating expenses, which pushed down the company in more losses in the recent period. Included in the growth of its operating expenses was the $50.4 million and $52.6 million increase in advertising; and operations technology, general and administrative expenses, respectively.

“We are pleased to report yet another exceptional quarter with strong momentum in revenue growth and profitability.
“As consumers increasingly embrace the selection and convenience of shopping online instead of in physical brick and mortar stores, we are taking advantage of that shift and capturing market share by offering a truly differentiated, customer-centric shopping experience. From our new Search with Photo feature that allows customers to quickly find exactly the right item in a matter of seconds to our pioneering work in augmented reality technology making it possible for shoppers to see items in their home at scale before they make a purchase, we are reinventing retail and raising the bar on customer experience each and every day. Our Castlegate and Wayfair Delivery Network initiatives are enabling us to delight customers with faster delivery speeds and a seamless shopping experience from start to finish, and we are continuously expanding our product offering across multiple categories including plumbing, flooring, door and cabinet hardware, mattresses, seasonal décor and housewares. All of these developments are resonating strongly with customers, and we are excited to see strong traction for the Wayfair brand and shopping experience across the United States and our international markets in Canada, the United Kingdom and Germany. We look forward to entering the second half of the year with tremendous momentum.”
Niraj Shah, CEO, co-founder and co-chairman, Wayfair

Valuations
Wayfair has consistently recorded losses in the past five years, including its recent ten months of operations, therefore, leading to no trailing P/E ratio. Meanwhile, Wayfair had P/B ratio 509.3 times vs. industry median 1.67 times, and P/S ratio 1.53 times vs. 0.7 times (GuruFocus data). Average fiscal 2017 revenue expectations indicated forward P/S ratio of 1.32 times.

Total returns
Despite ongoing losses, Wayfair has provided an outstanding 99.09% total gains for its shareholders so far this year compared with the S&P 500’s 11.29% (Morningstar).

Wayfair
According to filings, Wayfair was founded in May 2002. From 2002 through 2011, the company was bootstrapped by its co-founders and operated as hundreds of niche websites, such as bedroomfurniture.com and allbarstools.com.

In late 2011, Wayfair made the strategic decision to close and permanently redirect over 240 of its niche websites into Wayfair.com to create a one-stop shop for furniture, décor and home goods and to build brand awareness, drive customer loyalty and increase repeat purchasing.

From 2012 to 2016, Wayfair aided brand awareness in the U.S. grew from 6% to 77%. Over the last few years, the company also has invested in expanding our international business in Canada, the United Kingdom, and Germany by building its international infrastructure, growing international supplier networks, and establishing its brand presence in select countries.

Wayfair’s business is in the home goods market with an addressable market size of $270 billion and still growing, of which ~9% is sold online today.

Wayfair is one of the world’s largest online destinations for the home. Through the company’s e-commerce business model, the company offers visually inspired browsing, compelling merchandising, easy product discovery and attractive prices for over eight million products from over 10,000 suppliers.

According to filings, the target Wayfair customer is a 35- to 65-year-old woman with an annual household income of $50,000 to $250,000, whom the company considers to be a mass-market consumer and believes that it is underserved by traditional brick and mortar and other online retailers of home goods.

The company is able to offer this vast selection of products because it holds minimal inventory. Further, products are shipped to Wayfair’s customers directly from its suppliers, or increasingly from the company’s CastleGate fulfillment network, “CastleGate.”

Wayfair’s CastleGate solution enables its suppliers to forward-position their inventory, allowing faster delivery to the customer with lower rates of damage and lowering Wayfair’s cost per order over time.

Wayfair has two operating and reportable segments, U.S. and International.

U.S.
In the first half, revenue in the U.S. increased by 29% to $1.86 billion (89% of total unadjusted sales) and had an adjusted EBITDA of $24.2 million compared to (-)$3.96 million in adjusted losses a year earlier.

International
In the first half, Wayfair’s international business grew impressively at 138.9% year over year to $228.6 million and recorded adjusted losses of (-)$47.3 million compared to (-)$41.9 million a year earlier.

Sales and profits
In the past three years, Wayfair registered a revenue growth average of 54.54% (Morningstar).

Cash, debt and book value (equity)
As of June, Wayfair had $203.8 million in cash and cash equivalents and $82.73 million in lease financing obligations leading to a leverage ratio of 6.93 times compared to 0.18 times a year earlier. Overall lease obligations increased by $52.8 million year over year while equity declined by (-)$150 million.

Cash flow
In its recent first half operations, Wayfair had (-)$28 million in cash outflow from its operations compared to (-)$26.3 million a year earlier. Capital expenditures including software development costs were $68.2 million leaving Wayfair with (-)$96.2 million in free cash outflow compared to (-)$100 million a year earlier.

The cash flow summary
In the past three years, Wayfair allocated $236 million in capital expenditures, raised $438 million in common and preferred share issuances, generated (-)$34 million in free cash outflow, and provided $69 million in dividends and share repurchases.

Conclusion
Despite being 17-year-old website company, Wayfair still has exhibited relatively consistent high revenue growth rate. With its huge potential addressable market, this could be the reason why the market has exuberantly rewarded the company even without the capacity of generating profits, at least in a coming couple of fiscal years as per analysts estimates.

The company also has remained debt free in the past decade except for its lease financing obligations.

Analysts have an average overweight recommendation on Wayfair shares with a target price of $82.24 a share vs. $69.79 at the time of writing.

High risk-tolerant investors who do not care about Wayfair’s difficulty in generating profits and 509 times book value should consider starting accumulating some of the company’s shares since it is undervalued compared to estimates.

Disclosure: I do not have shares in any of the companies mentioned.

Back.

pencil-918449_640

Back to writing here on this blog. Exactly one year after the last post.

Please stay tuned (subscribe) in for some thorough company reviews.

Mark Y.